



Strategy & Organizations
Is the release of GTA 6 visible on the power grid?


After 13 years of waiting, on 19 November 2026 at midnight, millions of players were finally able to access GTA 6 at the same moment. The excitement, on social media as well as in traditional media, pointed to large-scale crowd behaviour. Did all these consoles and screens switched on in sync leave a visible trace on France’s electricity consumption? To find out, we built a baseline scenario and compared it with actual data. This small thought experiment sheds light on a big question: how do you steer a decentralised system that nobody controls?
When a whole country does the same thing at the same time
In the United Kingdom, grid operators spotted the phenomenon early and nicknamed it the “TV pickup”. At half-time in a big match, millions of viewers get up together to switch on the kettle, open the fridge or turn on the kitchen light. Electricity demand jumps within minutes.
The record dates back to the 1990 World Cup semi-final between England and West Germany. At the end of the penalty shoot-out, 2,800 megawatts (MW) were drawn at once, the equivalent of more than a million kettles. For reference, a French nuclear reactor produces about 1,000 MW, or 1 gigawatt (GW).
In France, the phenomenon takes another form: when Les Bleus play, the country comes to a standstill. During Euro 2016, consumption could fall by 3,700 MW during the first half of big matches, and RTE, the grid operator, expected a rebound of about 500 MW at half-time. A similar rebound was observed during the 2022 France-Morocco semi-final.
Voluntary actions count too. During Earth Hour, when eco-conscious citizens switch off their lights for an hour, researchers from Johns Hopkins University and Lawrence Berkeley National Laboratory measured an average 4% drop in consumption across ten countries.
GTA 6, a global phenomenon
GTA 6 was released on Thursday 19 November 2026, on PlayStation 5 and Xbox Series. Its predecessor, GTA V, passed 1 billion dollars in sales within three days in 2013, a record for a cultural product. It has since sold more than 230 million copies.
Available for pre-download since 10 November, the sixth installment unlocked at midnight, local time, in every region. In France, players could start playing during the night. Already installed on millions of consoles, it could be launched on the stroke of midnight.
The expected electrical signal is more diffuse than a football match. Consoles and screens stayed on for hours, in the middle of the night, when national consumption is low and falling steeply (it usually reaches its low point around 4 am).
Measuring the invisible: the counterfactual challenge
How can we tell that an event changed consumption? We need to compare what happened with what would have happened without it. Economists call this fictitious scenario a counterfactual. The effect of the event is the gap between the two curves.
Three obstacles complicate the exercise:
- The weather. In France, where electric heating is widespread, each degree less raises demand by about 2.5%. A small temperature error can therefore mask a real effect.
- Coincidences. Holidays, bank holidays or water heaters switching on automatically during off-peak hours alter the curve at the same times.
- Forecast inaccuracy. Every model is somewhat wrong. An effect smaller than this margin of error remains invisible, even if it exists.
Researchers have several approaches at hand. The most intuitive relies on history: the British operator anticipates these peaks from the weather, consumer behaviour and past major events. During the Covid crisis, richer statistical models made it possible to measure the effect of lockdowns on European demand. The most recent work adds a confidence band around the baseline scenario, to tell whether a gap is significant or due to chance.
Building a demand forecast, a complex exercise
To help identify a possible “GTA effect”, we built an ex ante baseline scenario from the data available before the release. Half-hour by half-hour, it takes the average of the three recent weekday evenings closest in temperature. We compared it with the consumption measured by RTE and with the forecast that RTE updates on the day itself.
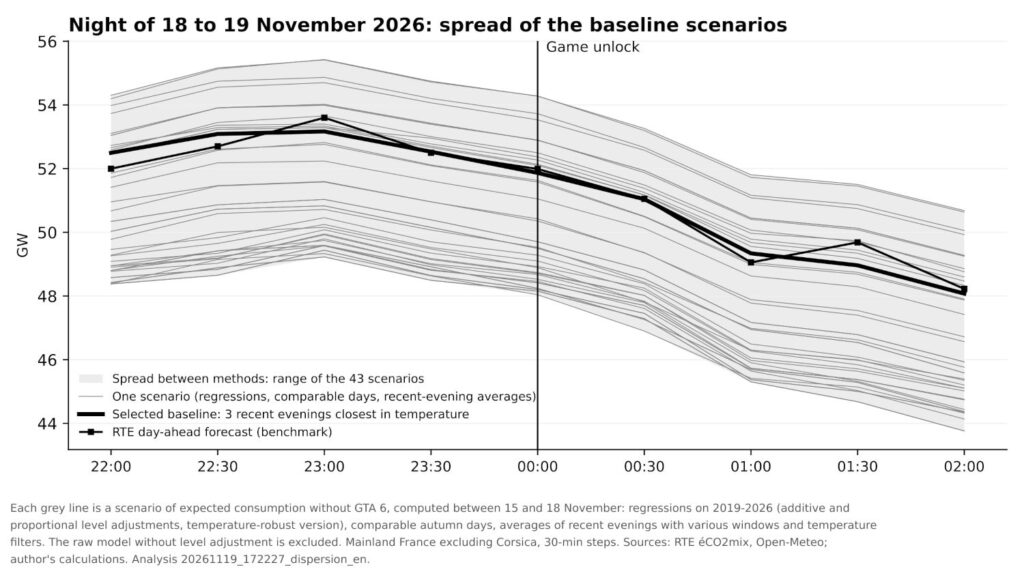
Establishing a reliable baseline proved complex, for lack of detailed data. By combining several methods based on history and comparable situations, we obtained 43 plausible scenarios for this single night, whose gaps far exceeded the potential effect of the game.
This uncertainty is heightened in autumn, when consumption changes quickly with the weather and heating.
To forecast demand, energy specialists generally combine statistical models, based on past data, and deterministic models, based on the different uses of electricity. This is notably the approach taken by RTE.
Verdict: comparing the scenario with what actually happened
The chart below shows the first consumption data for the night. Until midnight, France consumed about 1,000 MW less than expected: a quieter evening, partly thanks to slightly milder weather. Between 11:30 pm and midnight, our forecast and RTE’s expected a fall of 700 to 1,000 MW but, in reality, consumption dropped by only 200 MW. This break exceeds anything we observed over sixty ordinary evenings. Measured against the evening level, the gap reaches about 800 MW between midnight and 2 am. This calculation assumes that the evening dip held for the whole night.
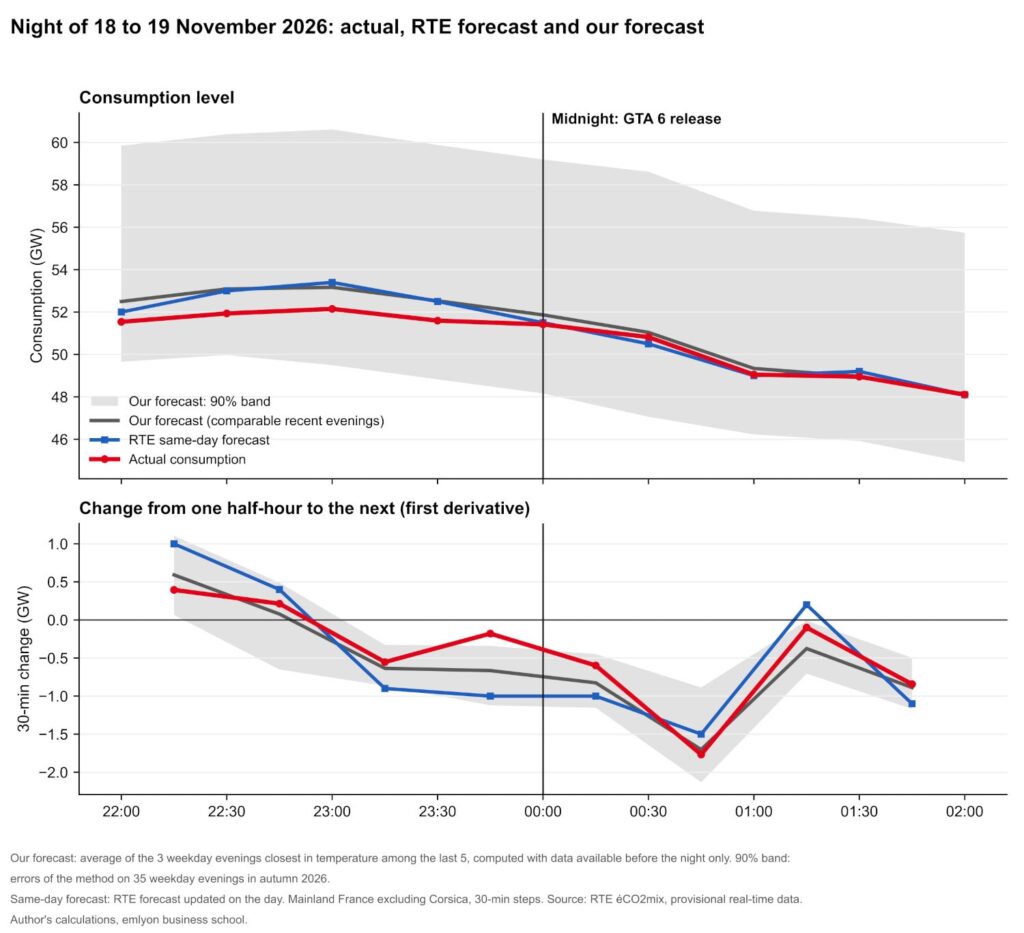
Correlation is not causation. Nothing in these national curves allows this gap to be attributed to consoles. The coincidence with midnight is striking, but an evening that is unusual for other reasons, or the mere chance of a single night, can produce the same shape. The signal also stands out clearly with only one of our methods, and RTE’s data remain provisional. The decision rule we had frozen the day before, using other calculation methods, nevertheless reaches the same conclusion.
An order-of-magnitude calculation suggests that the GTA 6 hypothesis is plausible. If a large share of the observed consumption gap is indeed linked to the game, this would mean that about 1 to 1.5 million people were playing simultaneously at launch. That would represent between 20% and 30% of owners of latest-generation consoles in France, a high level but consistent with the exceptional anticipation surrounding this release.
No need to worry: the power system can handle such swings
Even if the “GTA 6 effect” is real, the French grid is designed to absorb far worse: the sudden loss of a 1,500 MW nuclear reactor. To do so, RTE has power reserves that are mobilised in stages:
- Within a few seconds, power plants automatically adjust their output to stabilise the grid.
- A second automatic reserve, of at least 500 MW, takes over.
- If the imbalance persists, RTE manually activates other resources: at least 1,000 MW in under 13 minutes, then reinforcements in under 30 minutes.
These resources are procured on the balancing market. Generators, industrial sites able to cut their consumption and storage facilities offer their services there.
Thinking in systems, a strategic skill
Stepping back from the thought experiment we have just developed, what stands out is that, if the collective effect is there, nobody decides on a behavioural consumption peak. Millions of individual, ordinary and independent decisions together produce a behaviour that no one wanted. Specialists call this emergence, a central notion of systems thinking popularised by Donella Meadows in Thinking in Systems in 2008.
The power grid shows how to govern such a system. RTE combines three levers: a solid statistical forecast, safety margins calibrated on the worst plausible scenario, and a market able to mobilise solutions within minutes. Forecast, protect, react: a triad from which many companies could take inspiration.
This posture is nonetheless costly and calls for a managerial trade-off between economic efficiency, focused on results, and resilience, which has only an option value, meaning that it becomes tangible only if the adverse circumstances one seeks to guard against actually materialise.
For the power system, the stakes of this trade-off are set to grow in the years ahead. Electric cars, heat pumps, data centres: electrification multiplies the devices able to start at the same instant, on a price signal, a software update or the release of a game. Will tomorrow’s leaders be able to think in systems before being caught out by them?